概要
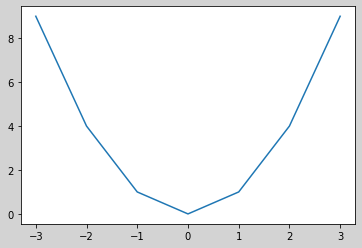
plt.figure(facecolor="色")を使って、plotするグラフの外枠の背景に色を付けることができる。
コード
import matplotlib.pyplot as plt
x = [-3, -2, -1, 0, 1, 2, 3]
y = [9, 4, 1, 0, 1, 4, 9]
plt.figure(facecolor="lightgray")
plt.plot(x, y)
plt.show()
結果
plt.figure(facecolor="色")を使って、plotするグラフの外枠の背景に色を付けることができる。
import matplotlib.pyplot as plt
x = [-3, -2, -1, 0, 1, 2, 3]
y = [9, 4, 1, 0, 1, 4, 9]
plt.figure(facecolor="lightgray")
plt.plot(x, y)
plt.show()