概要
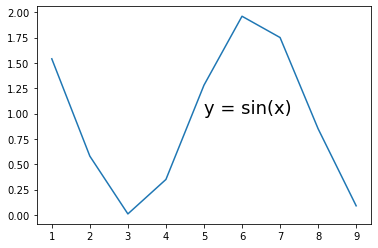
plt.text(x座標, y座標, "文字", fontsize=フォントサイズ)を使うことで、plotしたグラフへ文字を挿入することができる。
コード
import matplotlib.pyplot as plt
x = [1, 2, 3, 4, 5, 6, 7, 8, 9]
y = [1.54, 0.58, 0.01, 0.35, 1.28, 1.96, 1.75, 0.85, 0.09]
plt.plot(x, y)
plt.text(5, 1, "y = sin(x)", fontsize=18)
plt.show()
結果
