概要
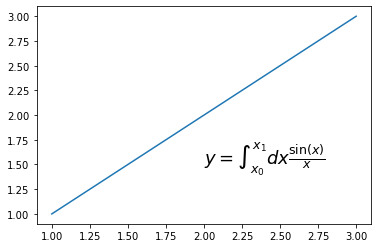
plt.text(x座標, y座標, r'$Tex形式$', fontsize=フォントサイズ)を使うことで、Texの書式でplotしたグラフへ数式を書くことができる。
コード
import matplotlib.pyplot as plt
x = [1, 2, 3]
y = [1, 2, 3]
plt.plot(x, y)
plt.text(2, 1.5, r'$ y = \int_{x_0}^{x_1}dx \frac{\sin(x)}{x} $', fontsize=18)
plt.show()
結果
