概要
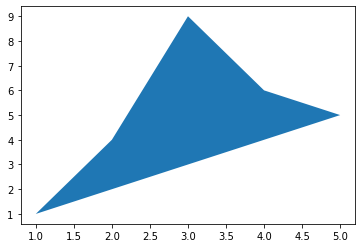
matplotlibでplt.fill(x座標, y座標)を使って、折れ線グラフを塗りつぶすことができる。
コード
import matplotlib.pyplot as plt
x = [1, 2, 3, 4, 5]
y = [1, 4, 9, 6, 5]
plt.figure()
plt.fill(x, y)
plt.show()
結果
matplotlibでplt.fill(x座標, y座標)を使って、折れ線グラフを塗りつぶすことができる。
import matplotlib.pyplot as plt
x = [1, 2, 3, 4, 5]
y = [1, 4, 9, 6, 5]
plt.figure()
plt.fill(x, y)
plt.show()